
The Peerless Prognosticator is ON THE AIR!!!
Washington Capitals (44-26-12)
vs.
Florida Panthers (58-18-6)
Then and Now I
It will surprise few Caps fans that this year’s edition of the club is inferior to last season’s club, at least in terms of their rankings across statistical categories. The one thing that does stand out in a good way, though, is the Caps’ success on the road. They were tied for first in road wins both last season and this, and their 44 wins combined over the last two seasons are three more than Carolina, Colorado, and the Caps’ first round opponent Florida compiled. For those who might have forgotten, the Caps tied an all-time record with ten road wins in the 2018 postseason, matching the totals of four other teams prior to that achievement (St. Louis and Tampa Bay have since tied that record). On the other hand, those home win totals in each season trailing the road win totals is a problem. The 36-win total on home ice over the past two seasons rank 17th in the league. But if you need another refresher, the Caps won only six of 11 home games on their way to the Stanley Cup in 2018. The road might not be the easiest path to winning a championship, but it can be navigated.
Looking at those year to year changes line-by-line. It is not a pleasant thing to contemplate. And when you compare this year’s Caps’ rankings to those of the Panthers, the picture takes a darker turn. They have a better road win total and a better penalty kill. But the Panthers not only rank higher than the Caps or are tied in the other categories, Florida ranks first in six of the 11 categories overall.


Then and Now II
The Caps and Panthers met three times this season, the Caps going 1-1-1. Washington also happened to be the only team in the league to hit up the Panthers for four goals three times. Some odd facts about those three games…
- On special teams, one team would be successful, the other would not, all three times. The Caps went 1-for-3 in the middle game of the season series, while the Panthers were 0-for-3. In the first and third games, the Panthers went 1-for-3 and 2-for 4, respectively, while the Caps were shut out on two chances in each game.
- The Caps outshot the Panthers twice, 42-33 in the 5-4 overtime loss on November 4th in the first game of the season series and 29-22 in the Caps’ 4-3 win on November 26th in the middle game of the series. The Panthers lit up the Caps for 51 shots in their 5-4 win over the Caps on November 30th.
- The Caps scored first in one of the three games against Florida. It was the one they lost in regulation (5-4 on November 30th).
- Florida was one of two teams the Caps had three one-goal games against. The other team was the other Florida team, the Tampa Bay Lightning. The Caps went 1-1-1 against them, too.
- The Caps lost both games when they were a “minus” in net penalties; they won when they split six penalties with the Panthers, a 4-3 decision on November 26th.

How Caps of you to notice…
Florida averaged 4.11 goals per game in the regular season. In 28 games when allowing four or more goals this season, the Caps went 3-19-6.
How Caps of you to notice II…
In the Ovechkin era, the Caps have allowed four or more goals in a game 38 times. They are 4-34. Get the feeling that if Florida is “average,” by their standards, they’re going to make short work of the Caps?
Never Ever…Again
This will be
the Caps’ 32nd trip to the postseason. They (still) have yet to sweep a seven-game
series. Yeah, yeah...we've mentioned this before.
The Magic Number
40. If the Caps’ shot meter climbs above 40 shots, that is not necessarily a good sign. In the post 2004-2005 lockout era, the Caps have posted 40 or more shots 18 times in the playoffs. They are 6-12 in those games.
The Cast of Skaters
Washington spread the scoring around fairly well against Florida this season. Of the 22 skaters to face the Panthers this season, 16 posted at least one point. Eleven of them are likely to get regular work in this series. As one would expect, Alex Ovechkin led the team in both goals (four) and points (six). However, that is one-third of the goal total the Caps had against the Panthers this season, which makes Ovechkin’s availability early in the series an even more important consideration (he missed the last three games of the regular season with an upper body injury). The odd thing here is that Connor McMichael has two goals, one of two other Capitals with multi-goal seasons against Florida (Tom Wilson is the other). He has the only “first goal” scored by a Capital in the three-game series, and Florida is the only team against which he has more than one goal in his career to date.
Of the skaters likely to dress on a regular basis for the Caps in this series, only Conor Sheary and Martin Fehervary have negative ratings (minus-1 and minus-2, respectively). Nick Jensen is a rather amazing plus-5 at the other end of the rating scale. Although the statistic is not included in the accompanying table, three Caps were credited with double-digit hit totals in the season series against Florida. They would be the usual suspects – Martin Fehervary (15), Garnet Hathaway (13), and Tom Wilson (12). Hathaway and Fehervary are the only skaters among 13 appearing in all three games without a point. Hathaway is the only Capital to have drawn two penalties in the series, but he also has taken a pair for an ”even” net penalties drawn. Nick Jensen and Evgeny Kuznetsov are the only Caps likely to get significant playing time in this series with a plus net penalties taken, both with a plus-1 (Mike Sgarbossa is also plus-1).

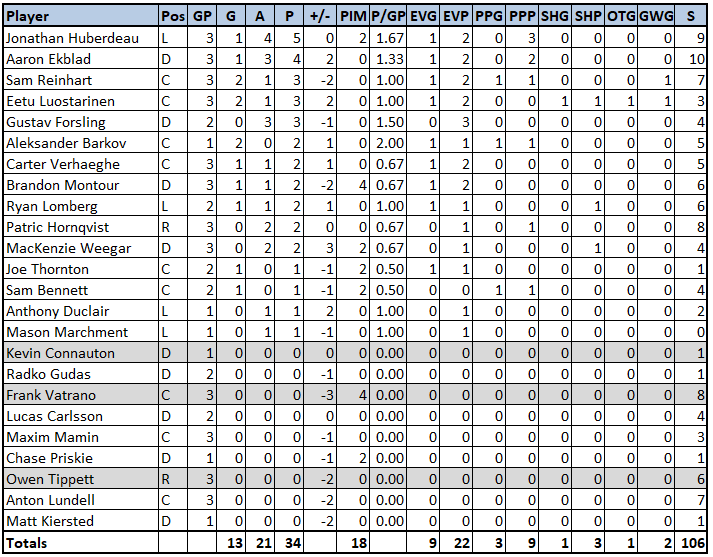
On the other side, three Panthers had multi-goal seasons against the Caps – Sam Reinhart, Eetu Luostarinen, and Aleksander Barkov (two apiece). Jonathan Huberdeau led the team against the Caps with five points; he had assists on all three Florida power play goals scored in the series. Overall, ten Panther skaters recorded goals, and 15 recorded at least one point. Reinhart and Luostarinen have the game-winning goals for Florida in the series, Luostarinen’s coming in overtime. Huberdeau also tied for the team lead in credited hits (seven) with MacKenzie Weegar and Maxim Mamin. Aaron Ekblad also had multiple power play points (0-2-2) and led the team in shots on goal against the Caps, the only Panther in double digits (10). He also led the team in giveaways (seven). Weegar led the team in takeaways (nine).
Working with a net
Anyone who has been paying attention to the Caps, even causally, for most of the season knows that goaltending is an issue for the Caps. Neither Ilya Samsonov (23-12-5, 3.02, .896, three shutouts) nor Vitek Vanecek (20-12-6, 2.67, .908, four shutouts) have been able to grab the number one goaltending job by the throat and make it their own. What is worse, both finished the season poorly. Samsonov was 10-7-2, 3.29, .889 since February 1st, while Vanecek was 10-6-1, 3.06, .898, with two shutouts over the same period. In his last 18 games, Samsonov allowed three or more goals 13 times, while Vanecek did so 12 times in his last 15 games.
In the season series against Florida, Samsonov got most of the work, but it was a tough slog for the young netminder. The 11 goals he allowed to Florida were the most he yielded to any team this season. To be fair about it, the 91 shots he faced from the Panthers were the second-highest volume of shots he faced from any team (Pittsburgh: 109). What might be most troubling is that of 49 goalies to face at least 20 shots at even strength against Florida this season, Samsonov’s even strength save percentage (.895) ranks 33rd.
Vanecek is an unknown quantity when it comes to his experience against Florida. The 36:22 he logged in a 5-4 overtime loss on November 4th (the overtime loss was put on his record for allowing the OT goal) is all the ice time he has for his career against the Panthers.
On the other side, Sergei Bobrovsky has a long history of disappointment in the postseason. In 41 postseason games since he came into the league in 2010-2011, he is 13-23, 3.24, .899. Of 50 goalies facing at least 500 shots in the playoffs over that span, his goals against average ranks 49th, and his save percentage ranks 48th. Sixteen times in those 41 games he allowed four or more goals, tied for sixth-most among all goalies over that period. And it is not as if he has gotten appreciably better over time. Over his last ten postseason games he allowed four or more goals six times, and only twice in nine starts did he allow fewer than three goals.
Bobrovsky did not have a good season against the Caps, going 1-1-0, 3.36, .887 in 125 minutes of work. And, it is not as if he has had a good career against the Caps. His regular season record is 10-13-5, 3.05, .898, with one shutout, while his postseason record against Washington is 2-4, 3.18, .900 (with Columbus in 2018). In none of those six games did he allow fewer than three goals.

Who’s Hot ‘n’ Not?
For the Capitals over the last ten games of the regular season…
HOT – John Carlson (3-5-9 (led team in points), plus-2, led team in shots on goal (28), tied for team lead in power play points (three), plus-3 goal differential on ice at even strength; 16 blocked shots (led team))
HOT – Alex Ovechkin (5-2-7 (led team in goals), plus-3, 25 shots on goal, plus-3 goal differential on ice at even strength, 18 hits (sixth on team) despite playing in only seven games)
HOT – Evgeny Kuznetsov (1-7-8, tied for team lead in points and power play points, led team in assists)
HOT – Anthony Mantha (2-6-8 (tied for team lead in points), plus-6 (led team), led team in even strength points (eight), plus-6 goal differential on ice (led team), led team in shot attempts percentage on ice at 5-on-5 (63.5 percent; minimum: three games))
HOT – Justin Schultz (2-6-8, one power play goal, two power play points, 17 shots on goal (second among defensemen), 11.8 shooting percentage (leads all defensemen appearing in more than two games), 13 blocked shots (second on team))
NOT – Tom Wilson (1-1-2, even, 13 penalty minutes (led team), 4.8 shooting percentage)
NOT – Trevor van Riemsdyk (0-3-3, minus-3, on ice for 11 even strength goals against (tied for most on team), minus-3 goal differential on ice at even strength (tied for worst on team)
NOT – Goalies (combined 4-4-2, 3.38, .876, one shutout)
NOT – Nicklas Backstrom (0-3-3, even, no power play points, seven shots on goal)
NOT – Evgeny Kuznetsov (yeah, he shows up in both HOT and NOT, but he is 1-for-20 shooting over his last ten games (5.0 percent))
For the Panthers over the last ten games of the regular season…
HOT – Sam Reinhart (6-5-11 (led team in goals, tied for second in points), 37.5 shooting percentage (led team), two game-winning goals (tied for team lead))
HOT – Claude Giroux (1-11-12 (led team in assists and points), five power play points (tied for team lead), 1.50 points per game (led team))
HOT – Jonathan Huberdeau (3-8-11 (tied for second in points), five power play points (tied for team lead), 1.38 points per game (second on team))
HOT – Brandon Montour (2-4-6 (led defense in points), plus-5 (tied for second on team))
HOT – Gustav Forsling (4-1-5 (led defense in goals), plus-9 (led team), 20.0 percent shooting (led defense, third on team), plus-8 goal differential on ice at even strength (led team))
NOT -- Eetu Luostarinen (0-4-4, even, seven shots on goal)
NOT – Robert Hagg (0-0-0, minus-3, five shots on goal, minus-3 goal differential on ice at even strength (tied for second-worst on team)
NOT – Radko Gudas (0-1-1, minus-1, eight shots on goal, minus-2 goal differential on ice at even strength)
NOT – Patric Hornqvist (0-3-3, minus-3, 26 shots on goal, minus-3 goal differential on ice at even strength (tied for second worst on team))
NOT – Joe Thornton (played in only four games, 0-1-1, minus-2, three shots on goal, no power play points, 12:21 in average ice time (lowest on team))
Looks at Rooks
Washington employed 11 rookie skaters in the regular season, more than the previous three seasons combined (ten) and the most since they use 11 rookies in 2013-2014. Nine members of this season’s rookie cohort posted at least one goal; ten had at least one point (Alex Alexeyev, who appeared in one game, was shut out). The group combined for 32 goals, 33 assists, and 65 points. Connor McMichael led the rookies in goals (nine), tied for the lead in assists (nine), and led in points (18), despite averaging only 10:28 in ice time over 68 games.
Martin Fehervary has had his ups and downs, especially as the season wore on, and he showed some signs of fatigue, but he has had what might be the best season of any of the rookies for the Caps. He leads his NHL rookie cohort of defensemen in goals scored (eight), finished sixth in that group in points (17), and is tied for second in plus-minus rating (plus-15). He is eighth among rookie defensemen in average ice time (19:39) and finished fourth in shots on goal (96). His plus-12 goal differential on ice at even strength was third among rookie defensemen.
Connor McMichael had an odd and largely frustrating season. When he was in lineup, he was generally productive on the offensive side of the puck, leading Caps rookies in goals and points, but he was also a minus-3 in goal differential on ice at even strength, tied for sixth-worst among 35 skaters appearing for the Caps this season. He did this while averaging only 10:28 in ice time per game. But in 16 games skating at least 12 minutes, the Caps were 11-3-2. They were just 8-6-2 when he skated less than nine minutes. This could very well be a reflection of the Caps shortening their bench when trailing in games, giving less ice time to players like McMichael, but it is just another nugget in what had to be a exasperating season for the rookie.
On the other side, the Panthers relied less on rookies than the Caps, both in number and in time spent. Seven rookie skaters took the ice for the Panthers this season, but only forward Anton Lundell dressed for more than ten game. It was a very good rookie season for Lundell, who finished 18-26-44, plus-33, in 65 games. He finished sixth among all rookie skaters in goals, seventh in assists, fifth in points, first in plus-minus, tied for fifth in game-winning goals, first in empty net goals (three), tenth in shots on goal (125), first in goal differential on ice at even strength (plus-31), and first in takeaways (59).
Special Considerations
This was not a good year for the Capitals’ power play. In 17 seasons since the 2004-2005 lockout, this year’s power play ranks 13th in efficiency (18.8 percent). It ranks tenth in power play chances per game (3.12), and only five Caps teams allowed more shorthanded goals than the nine the Caps gave up. The 37 games in which they recorded at least one power play goal ranks 12th in the 17 seasons since the 2004-2005 lockout.
Those games win which power play goals were scored has taken a wrong turn for the Caps. In their first two seasons after winning the Stanley Cup in 2018, the Caps recorded power play goals in 74 games, eighth-most in the league. In the most recent two seasons, however, that total was 62 games, 17th in the league. This season, the Caps had 48 power play goals, which tied Anaheim for 17th in the league. Given that the Caps finished sixth in power play chances per game, (3.12), this is a low total for the talent the Caps bring to the man advantage. And while the Caps did have 11 skaters record at least one goal with a man advantage, Alex Ovechkin had a full third of those goals (16). Evgeny Kuznetsov was next with eight. The power play just has not been particularly productive, and it has been heavily dependent on a single player as finisher. If Ovechkin is not ready to start this series (although indications are that he will play in Game 1), the power play is likely to be diminished even further.
The Caps’ penalty kill was not poor (80.4 percent/12th in the league), and it was not on the ice particularly often (2.74 times per game/12th-fewest in the league), but it did finish relatively poorly. In 14 games in April to close the season, the Caps were 30-for-38 (79.0 percent/22nd in the league). What helped mitigate the damage was the penalty kill being on ice 2.71 times per game in April, 10th-fewest in the league. This year’s penalty kill play ranks 11th among the 17 teams the Caps have iced since the 2004-2005 lockout. It also ranks third in shorthanded goals scored (eight). But the best thing about it might be its deployment, or lack of the need to do so. The 2.74 shorthanded situations faced per game are the fewest in the post-2004-2005 era.
On the other hand, Florida’s special teams are uneven. They have, as one might expect with as dominant a scoring offense as they have, a very good power play (24.4 percent/fifth in the league). And, as if this team needs more help scoring, they get to deploy that power play often, the 3.20 man advantages per game ranking second in the league, a big reason why their 64 power play goals ranked third in the league and most in the Eastern Conference. There is a bit of slippage here, though. The Panthers have allowed eight shorthanded goals, leaving their net power play at 21.4 percent, ninth in the league.
Florida’s power play is not dominated by a single individual to the extent Washington’s power play is dominated in goal scoring by Alex Ovechkin. Sam Reinhart leads the team with 16 goals, the same number as Ovechkin, but he accounts for 25 percent of the Panther power play output. Aleksander Barkov chipped in 12 goals, and 15 players overall have at least one power play goal. Five Panthers topped double digits in power play assists, led by Jonathan Huberdeau (33), and 17 players overall have at least one assists, bringing the number of skaters with power play points to 19, more than half the number of skaters the Panthers employed this season (35). Six players have at least 40 power play shots on goal. Florida brings the pressure, but one does wonder why the power play isn’t even more dominant than it was in the regular season.
Behind the Bench
You would think that a team with a head coach with 148 career playoff games with five teams would have an advantage over a coach with no playoff games on his resume and only 75 games of regular season experience. That is the matchup of the Caps’ Peter Laviolette against the Panthers’ Andrew Brunette (who has his own Caps connections, a seventh-round draft pick for the Caps in 1993 and for whom he went 18-22-40, plus-4, in 62 regular season games over three seasons). Laviolette has been to three conference finals with three different teams – Carolina (with whom he won the Stanley Cup), Philadelphia, and Nashvillle. His 76 postseason wins are 15th all-time and fourth among active coaches. On the other hand, he does have 72 losses in the postseason, 12th all-time and fourth among active coaches. But since he took Nashville to the Cup final in 2017, Laviolette is 10-14 in three trips to the playoffs over five seasons, getting out of the first round only in 2018 with the Predators.
Brunette was given his first NHL head coaching assignment (after assistant jobs in Minnesota and Florida) when Joel Quenneville resigned as head coach in the wake of revelations of his role in the sexual abuse scandal n Chicago Brunette took over a club that won its first seven games under Quenneville, a tough act to follow. His start was not all unicorns and accordions. He did win his first game, a 3-2 overtime win over Detroit, to extend the Panthers’ season-opening winning streak to eight games, but even with that win, he was just 3-2-3 in his first eight games, two of the wins coming in overtime. But his club followed that up with a four-game winning streak that was the start of a run over which Brunette and the Panthers went 48-16-3, finishing the season with the league’s best record and the Presidents Trophy winner. But as any Caps fan will tell you, the postseason is a different animal, and Brunette brings no postseason experience as head coach at the professional level to this series. He might be the biggest unknown for either team.
The Caps will in if…
They can get consistency our of their goalies, and discipline in front of them by the skaters, attributes that has been conspicuously absent over stretches this season, and scoring in depth. Whether it is Ilya Samsonov, Vitek Vanecek, or a combination of the two, they do not have to shut the Panthers down in every game. That is likely to be a bridge too far. The do need to put together consecutive games where they hold the Panthers to something less that four goals. Related, limiting Floirda’s shots will be important. The Caps did go 8-2-2 n the 12 games this season in which they allowed 35 or more shots, but one of those games was a 5-4 loss to the Panthers in which Florida wiped out a 4-1 Caps lead after two periods with four goals on 27 shots in the third period, 51 shots on goal for the game. Florida is no stranger to high shot volumes; they topped 50 shots four times this season (winning all four games) and had at least 40 shots in 31 games, going 24-5-2 in those games. If the Caps allow the Panthers to get pucks to the net, Florida’s depth in scoring talent could overwhelm the Caps.
Washington also has to get production out of the middle six forwards. This is an issue, since Nicklas Backstrom has struggled at times since his return from a hip injury), and Tom Wilson (who could get first- or second-line work) finished just 3-2-5 in his last 14 games after April 1st. Getting scoring depth was an important ingredient in the Caps’ Stanley Cup run in 2018 (they got 20 goals in 24 games out of Wilson, Lars Eller, and T.J. Oshie, for example).
Finally, the Caps need to use that 5-4 loss that closed the season series as an object lesson in playing to the final horn. There is no lead that is safe against the Panthers (their 11 wins when trailing after two periods led the league), and if the Caps play only 40 minutes – perhaps only 55 minutes – they are going to regret it.
The Panthers will win if…
Florida will win if they can dictate pace to allow their depth in scoring to flourish. The kind of depth Florida brings to the series can end up being relentless pressure that will just wear the Caps out. But they will also need to have goaltender Sergei Bobrovsky play at a level he has not reached in his postseason career. Florida can out-score the Caps if it comes down to a track meet, but if the Caps can gum up the works, the focus shifts to Bobrovsky and his ability to make key saves in close games.
In the end…
On paper, this series should not go more than five games. Florida is more talented, deeper, and perhaps in better health than the Caps to open the series. But there are potential demons here. Bobrovsky’s playoff history, the lack of postseason experience behind the bench, lack of broad playoff experience among the skaters with the Panthers, overconfidence (few pick the Caps to win). In an odd way, this series is the mirror image of the 2010 opening round, an offensive juggernaut with the best record in the league taking on a team that finished well behind in points and that does not impress many as a team with a chance to make a deep playoff run. The difference here is that the Caps would seem poorly constructed, especially in goal, to comeback from a 3-1 deficit in games, as the Montreal Canadiens did in 2010 to send the Caps to the golf course far earlier than anticipated. It puts a premium on the Caps punching the Panthers in the snout early. Do that, and they can send the Panthers to the links.
Caps in seven